Now you can view the diversity of Efling union’s members according to various factors.
Efling’s website now has a statistical dashboard where you can see the distribution of union members by ethnicity, job sectors, trades, gender and age. This new addition is part of Efling’s policy of providing transparent information to our members. The information in the dashboard will be updated regularly.
The dashboard gives a much better insight into the number of Efling’s members, how they are distributed in the labor market and general information about them. You can click on individual parts to view more detailed statistics, e.g. if you choose men aged 20-29 who work in nursing and care homes, you can see a more detailed breakdown by nationality and profession.
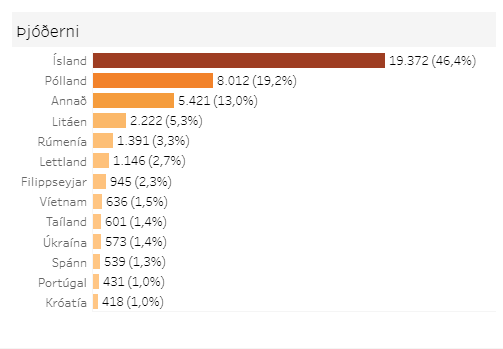
On the dashboard you can also see more general information, for example Efling´s members were 41.707 in 2022, which is divided into 144 nationalities. When the nationalities are examined in more detail, it can be seen that almost half are of Icelandic origin, or 19.372 people. The second largest group is from Poland, or 8.012 people, and the third largest group, 2.222 people, is from Lithuania. The fourth largest group is from Romania with 1.391 people and the fifth group is from Latvia with 1.146 people. Finally, 9.564 have other nationalities that are not detailed in this dashboard.
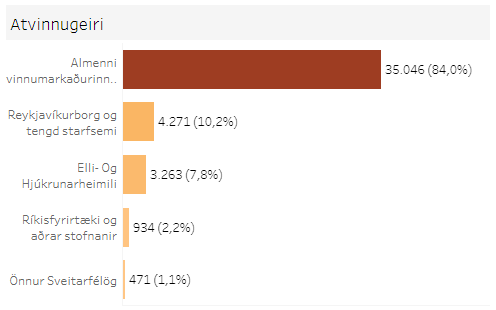
You can also see the division of members based on the main collective agreements and whether social workers work in private or public sectors. The private sector is by far the largest with 84% of members or 35.046 people. After that, about 10% work for the City of Reykjavík and related organizations, and then almost 8% work for old age and nursing homes. There are a total of 3.882 paid employees, but the largest part of them, or 3.815, are in the private sector.
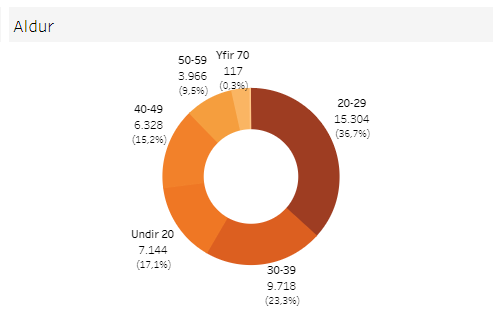
The majority of Efling’s members are between the ages of 20 and 29, or almost 37%. The next largest age group is 30-39 years old, which is around 23%. The third largest age group is under 20 years old, which is about 17% of the union members. Finally, a quarter of Efling’s members, or about 25%, are over forty years old.
Men make up more than half of Eflings’s members or 23.317. Women make up 18.354 members and 36 people are non binary.
Click below to view the statistics dashboard: